

Metrics to evaluate your Machine Learning algorithm
Evaluation Metrics every Data Scientist must know

A
Senior Software Engineer. I write about practical tips and epic stories about my experiences in the field of computer science and engineering!
Search for a command to run...
Evaluation Metrics every Data Scientist must know
Senior Software Engineer. I write about practical tips and epic stories about my experiences in the field of computer science and engineering!
No comments yet. Be the first to comment.
Stop guessing your maximum-pool-size. Learn how to calculate limits backwards from your database

Learn what Jib is, how it works, and when to use Jib vs Dockerfile. A guide with real-world scenarios

A prod debugging story you’ll probably relate to

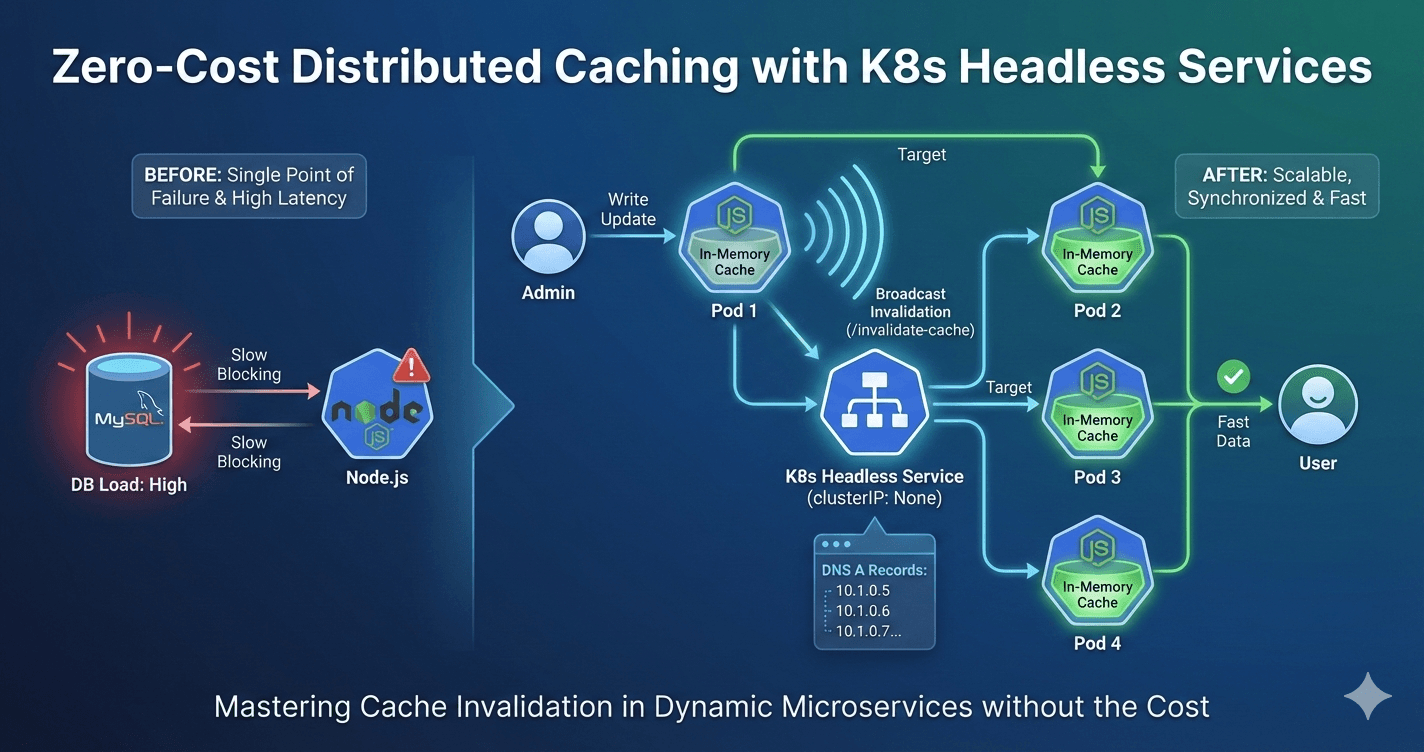
The $0 solution to a Distributed Cache Invalidation
Introduction At our current organization, earlier this year as we were looking at the errors at one of our signup API, we observed that nearly 5% of our requests were getting failed, all due to 400 BAD REQUEST errors, and the root cause was traced ba...

You made a machine learning or deep learning model. Amazing! 🥳
But how do you check its performance and robustness? Simply building a predictive model is not enough. You have to create a model which gives high accuracy on out-of-sample data.
That's where evaluation metrics come into the picture. They are used to measure the quality of the statistical or machine learning model, and this article will introduce you to the most common and yet important metrics to evaluate your machine learning algorithms.
If you're someone who just started out in the field of Data Science and Machine Learning, this is for you. We will discuss the following terms:
So let’s dive into it to learn about them :
A confusion matrix is one of the simplest concepts in the field of machine learning, and yet so important when it comes to statistical classification problems.
A confusion matrix is an N X N matrix, where N is the number of classes being predicted. It is usually used to describe the performance of a classification model based on the true values known for a data set.
In simple words, it is a summary of the prediction result made by the classification model.
True Positive (TP): True positive means their actual class value is 1 and the predicted value is also 1.
For example, The case where the woman is actually pregnant and the model also classifies that she is pregnant.
False Positive (FP): False positive means their actual class value is 0 and the predicted value is 1.
For example, The case where the woman is not pregnant and the model classifies that she is pregnant.
True Negative (TN): True negative means their actual class value is 0 and the predicted value is also 0.
For example, The case where the woman is actually not pregnant and the model also classifies that she is not pregnant.
False Negative (FN): False-negative means their actual class value is 1 and the predicted value is 0.
For example, The case where the woman is actually pregnant and the model also classifies that she is not pregnant.
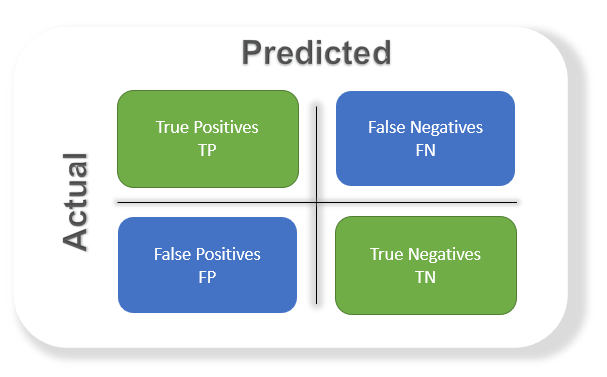
The confusion matrix in itself is not a performance measure but all the performance metrics are dependent on the confusion matrix.
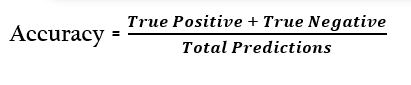
Accuracy is the most common metric that you can see everywhere when you're evaluating your model. It is simply defined as the number of correct predictions made by your model.
In simple terms, accuracy is the ratio of all the correct predictions to the total number of predictions.
It can be calculated using a confusion matrix.
Precision is defined as the total number of correctly classified positive examples by the total number of predicted positive examples.
In some cases, your classification model might classify based on the most frequent classes. Which in turn will bring a low accuracy because your model didn’t learn anything and just classified based on the top class.
Therefore, we need class-specific performance metrics to analyze. Precision is one of them.
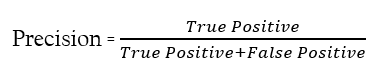
It depicts how much the model is right when it says it is right.
A recall (also known as sensitivity) refers to the percentage of total relevant results correctly classified by the classification model.
It is the the number of positive samples returned by the custom-trained model.
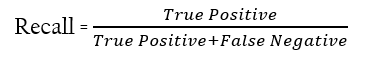
The relation between recall and precision -
This means, most of the positive examples are correctly recognized but there are a lot of false positives.
This means that we missed a lot of positive examples but those we predicted as positive are indeed positive.
Based on the use case of the classification model, the priority is given either to precision or recall, but in some classification models, we need both of these metrics to be combined as a single one.
F1-Score is a metric that combines both precision and recall and has an equal and relative contribution of both precision and recall.
It is the harmonic mean of precision and recall.
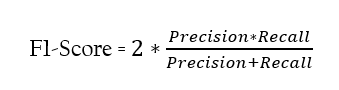
Remember that if your use case needs either recall or precision, one higher than the other then F1-score may not be the good metric for it.
Mean absolute error(MAE) is defined as the average of all errors that are calculated based on values predicted by your model.
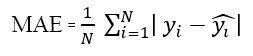
It is intended to measure average model bias in a set of predictions, without considering their direction

R squared is a measure of how close the data are to the fitted regression line. It is also known as the coefficient of determination.
It defines the degree to which the variance in the dependent variable (or target) can be explained by the independent variable (features).
For example, if the R-squared value for our predictive model is 0.8. This means that 80% of the variation in the dependent variable is explained by the independent variables.
Therefore we can say that the higher the r-squared value is, the better is the model.
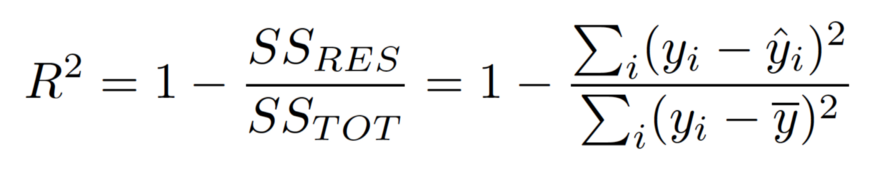
SSRES: the Residual sum of squared errors
SSTOT: the total sum of squared errors
RMSE is one of the most popular metrics used today for evaluating regression-based models. This is an important evaluation metric since it’s essential to find the average squared error between the predicted values.
RMSE measures the average magnitude of the error. It’s the square root of the average of squared differences between prediction and actual observation.
RMSE is highly affected by outlier values. Hence, make sure you’ve removed outliers from your data set prior to using this metric.
As compared to mean absolute error, RMSE gives higher weightage and punishes large errors
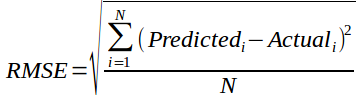
here 'N' is total observations.
Both of these metrics express the average error of the machine learning models. These two metrics can range from 0 to infinity and both of these metrics are negatively oriented scores, which means that a lower score defines better results.
ROC curve stands for “Receiver Operating Characteristic" Curve.
The ROC curve is a graph showing the performance of a classification model at all its cut-off thresholds.
In simple words, the ROC Curve is the one that tells how much your model is capable of differentiating among the different classes.
ROC is a probability curve. It is a representation of the performance of your model in a graphical manner.
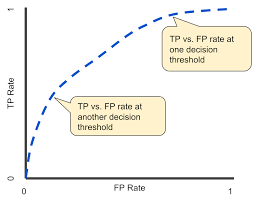
This curve represents:
The curve separates the space into two areas, one for good and the other for poor performance levels.
In this article, you have seen some important metrics that are helpful for model evaluation and need to be understood by a data scientist or a machine learning engineer.
I hope you have found it useful. Also please feel free to suggest corrections and improvements.
And if you're looking for a good Data Science course for upskilling yourself, you might consider exploring the offerings of Odinschool.
Thanks for reading :))
Understanding Linear Regression - One of the most popular algorithms in machine learning that every data scientist should know.
Having a go at common NLP tasks using TextBlob - Learn some of the basic operations to do in Natural language processing using TextBlob.
Generating unique IDs in a Large-scale Distributed environment - Learn how to create unique IDs for a distributed system at a large scale. Inspired by Twitter snowflake.
Useful Resources To Learn Web Development & To Create Your Website - Resources I found helpful in my web development journey