

Understanding Linear Regression

Introduction
Linear regression is one of the most popular algorithm in machine learning. There are primarily 2 types of machine learning algorithms that all other algorithms are divided into - Supervised and unsupervised learning algorithms and linear regression comes under the supervised learning algorithms.
In this article we will be discussing about :
Supervised learning algorithms
These machine learning algorithms are ones that is trained to predict a output that is dependent on the input data given by the user.
In the beginning, the model has access to both input and output data. The job of the model is to create rules that are going to map the input to the output.
The training of the model continues until the performance is at a required optimal level. After the training, the model is able to assign outputs objects that it didn’t encounter while it was being trained. In the ideal scenario, this process is quite accurate and doesn’t take a lot of time.
There are two types of supervised learning algorithms - classification and regression. In this article we will be looking at regression only
Regression
Regression is a type of predictive modelling technique which tells the relationship between a dependent and independent variable.
Types of regressions
Linear Regression
Logistic Regression
Polynomial Regression
Stepwise Regression
Logistic and linear regressions are the two most important types of regression out of those 4 that exist in the modern world of machine learning and data science.
Some key points regarding linear regression
It works best when the features involved are independent or to put it another way less correlated with one another.
It is also very sensitive to outliers. A single data point far from the mean values can end up significantly affecting the slope of your regression line, in turn, decreases your model's accuracy.
Purpose of Linear Regression
Analysis: Linear regression can help you understand the relationship between your numerical data i.e how your independent variables correlate to your dependent variable.
Prediction: After you build your model, you can attempt to predict the output based on a given set of inputs / independent variables.
Let's dive deeper
Linear regression is an enticing model because the representation is so simple.
For instance, in a simple regression problem (a single x and a single y), the form of the model would be: Y= β0 + β1x
(Here x is your independent value, Y is dependent variable, β0 is the intercept on y-axis, β1 is the slope of the line)
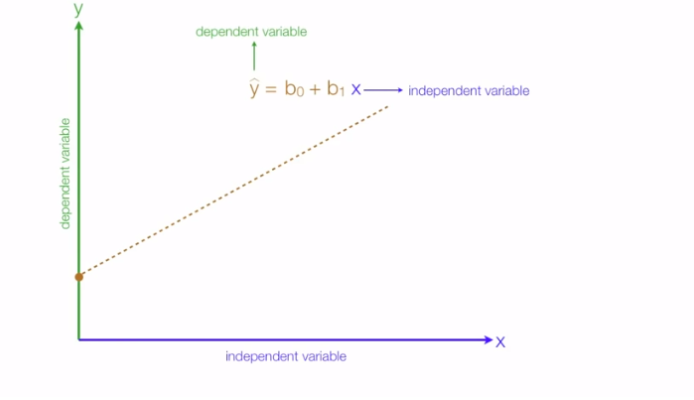
The line is called a hyper-plane or simply a plane. In real world scenarios we often have more than one input (x).
In linear regression we try to draw a plane which best fits our observation so that when a new observation comes we can predict the output from our hyper-plane.
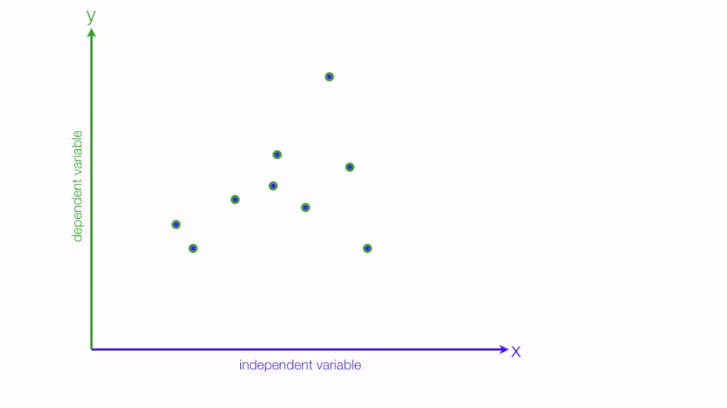
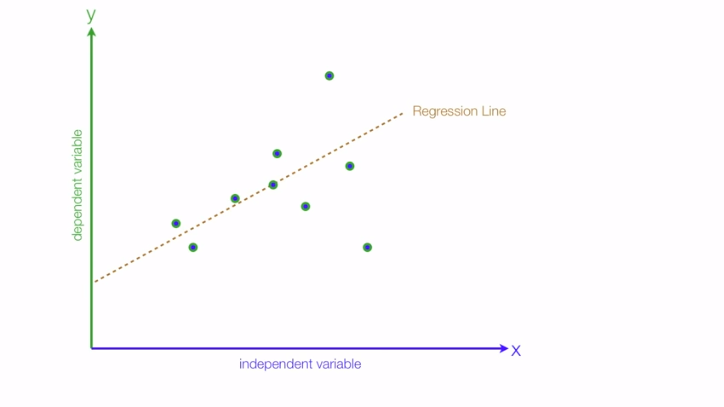
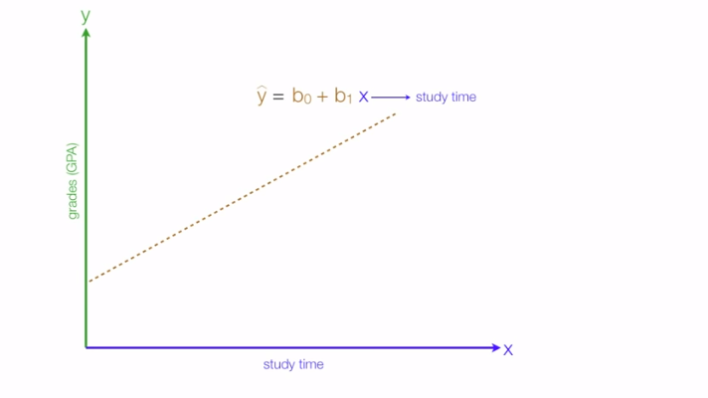
Another thing to know is the type of relationships between our dependent & independent variable, for instance consider your dependent variable(Y) to be the grades you'll get & independent variable(X) as the amount of time you study.
In this case the relationship turns out to be positive i.e the more you study the better grades you get:
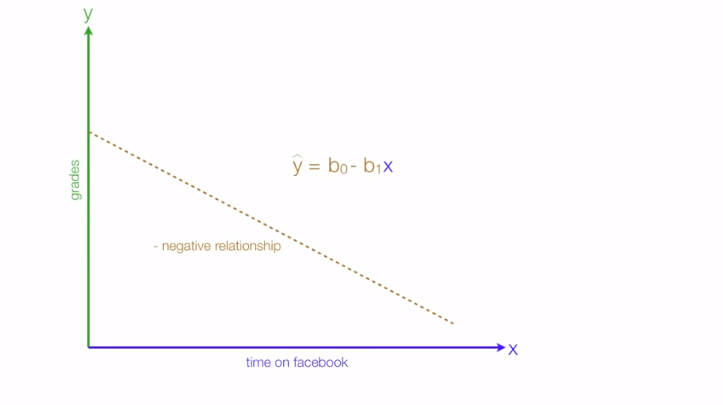
Another kind of relationship which regression tells is a negative relationship, in this case consider the independent variable as time spent on social media & dependent is again the grades we get:
Measuring Performance of our model
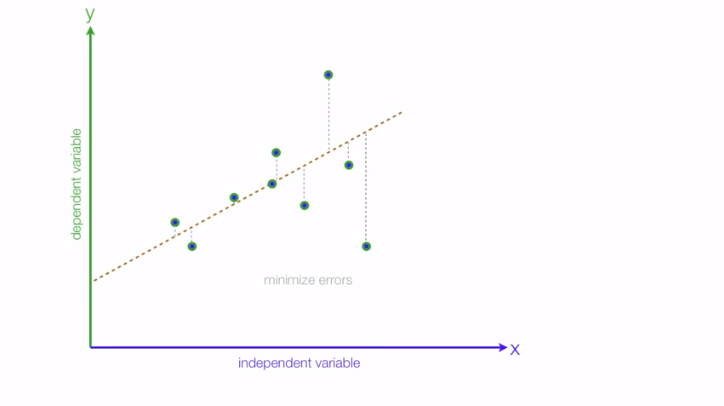
Whenever we draw the curve there are always the points that do not fit under the curve and there is always a slight difference between the actual & predicted value which is known as error. We can evaluate the performance of our model based on that, our aim is to decrease those errors.
The performance of the regression model can be evaluated by using various metrics let's see them one by one.
- Mean Absolute Error (MAE) In this we calculate the average absolute difference between the actual values and the predicted values.
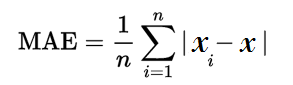
Where n = the number of errors, Σ = summation symbol (which means “add them all up”), |xi – x| = the absolute errors.
- Root Mean Square Error (RMSE) RMSE is the square root average of the sum of the squared difference between the actual and the predicted values.
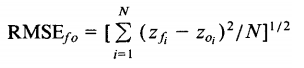
Where Σ = summation (“add up”), (zfi – Zoi)2 = differences, squared N = sample size.
- R-squared values R-square value is defined as the percentage of the variation in the dependent variable explained by the independent variable in the model.
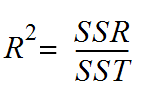
SSR = Residual sum of squares: It is the measure of the difference between the expected and the actual output. A small RSS indicates a tight fit of the model to the data.
SST = Total sum of squares: It is the sum of errors of the data points from the mean of the response variable.
R2 value ranges from 0 to 1. Higher the R-square value better the model. The value of R2 increases if we add more variables to the model irrespective of the variable contributing to the model or not. This is the disadvantage of using R2.
Underfitting and Overfitting Models
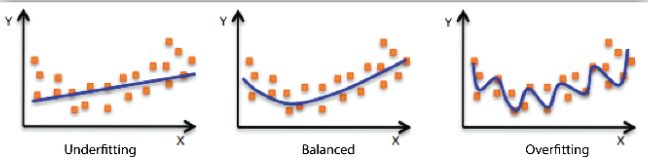
When we fit a model, we try to find the optimized, best-fit line, which can describe the impact of the change in the independent variable on the change in the dependent variable by keeping the error minimum. While fitting the model, there can be 2 events which will lead to the bad performance of the model. These events are
- Underfitting
- Overfitting
Underfitting is the condition where the model could not fit the data well enough. The under-fitted model leads to low accuracy of the model. Therefore, the model is unable to capture the relationship, trend or pattern in the training data. Underfitting of the model could be avoided by using more data, or by optimizing the parameters of the model.
Overfitting is the opposite case of underfitting, i.e., when the model predicts very well on training data and is not able to predict well on test data or validation data. The main reason for overfitting could be that the model is memorizing the training dataset. Overfitting can be reduced by doing feature selection.
Conclusion
Regression analysis is a widely adopted tool that uses mathematics to sort out variables that can have a direct or indirect impact on the final data.
In Machine learning & data science there are mainly 4 types of regression technique out of which linear regression is one of the most common algorithms used by data scientists to establish linear relationships between the dataset’s variables, and its mathematical model is necessary for predictive analysis.
Other articles that you might like
- GIT INIT (Part-1) - A series on GIT
- Bitcoin Mining - Learn about what exactly bitcoin mining is.
- Improving Time Complexity - Understanding how to improve the time complexity of your code.
- GPT-3 - A large open source state-of- the-art language model with more than 175 billion parameters by OpenAI.
About the author
Senior Software Engineer. I write about practical tips and epic stories about my experiences in the field of computer science and engineering!
Comments
Join the discussionWell written
Thanks Sreejith S 🙏
Great article! Thanks
Glad you like it😊


